
Visualize Rankings Over Time with Ribbon Charts in Power BI
Jul 17, 2024
Visualize Rankings Over Time with Ribbon Charts in Power BI
In today’s blog post, I’ll Walk you through
the process of creating a Ribbon Chart in Power BI, enabling you to visualize
changes in categorical rankings over time and gain deeper insights into your
data.
Introduction
Ribbon Charts in Power BI provide a dynamic
way to track the evolution of rankings across categories over a specified
period. They help in understanding shifts and trends, making them an excellent
tool for data analysis and storytelling.
Step
1: Prepare Your Data
Ensure that your dataset is structured
appropriately for a Ribbon Chart. Typically, you need a categorical variable
and a measure.
Step
2: Load Data into Power BI
- Open
Power BI Desktop.
- Click
on Home > Get Data.
- Select
the data source (e.g., Excel, SQL Server) and load your data.
Step
3: Create the Ribbon Chart
- In
the Visualizations pane, select the Ribbon Chart icon.
- Drag
and drop your categorical field (e.g., Category) to the Axis well.
- Drag
and drop your measure (e.g., Sales) to the Values well.
Step
4: Customize the Ribbon Chart
- Format
the Chart:
- Click
on the Ribbon Chart to select it.
- In
the Visualizations pane, go to the Format tab.
- Customize
the following options:
- Data
colors: Change the colors for the
ribbons.
- Data
labels: Turn on/off data labels and
customize their appearance.
- Legend:
Enable or disable the legend and customize its position and appearance.
- Title:
Add a chart title and customize its appearance.
- Sort
the Data:
- Ensure
that your data is sorted appropriately to reflect the flow of the
ribbons. You can sort by different fields using the Sort by option
in the visualizations pane.
Step
5: Add Interactivity
- Use
Slicers to add interactivity to your Ribbon Chart:
- Add
slicers to filter data dynamically.
- Drag
relevant fields to the slicer and format it as needed.
Step
6: Save and Publish
- Save
your Power BI report.
- Publish
it to the Power BI Service to share with others.
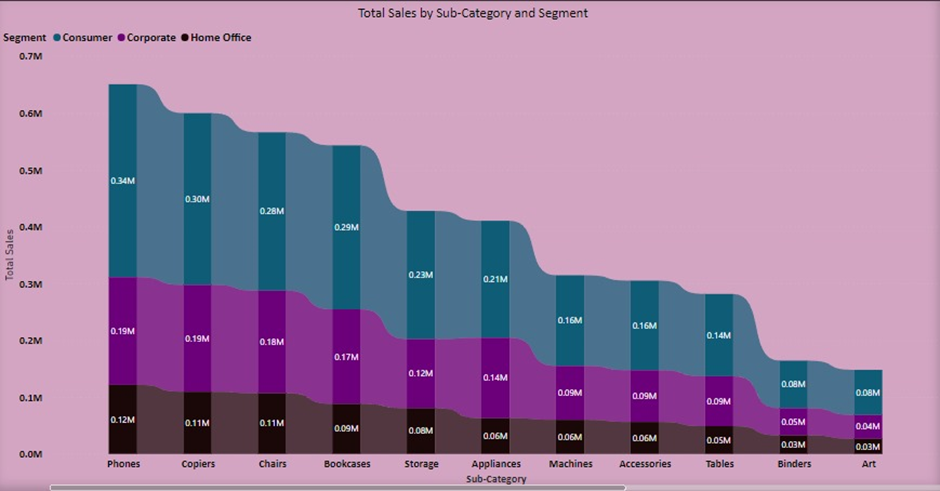
Example
Use Case
Imagine you have sales data for different
product categories across multiple years. You want to visualize how the rank of
each category changes over time. A Ribbon Chart is perfect for this scenario:
- Load
your sales data into Power BI.
- Create
a Ribbon Chart.
- Drag
the Category field to the Axis and the Sales field to Values.
- Format
and customize the chart.
- Use
slicers to allow users to filter the data by year or other dimensions.

Tips
for Effective Ribbon Charts
- Ensure
your categories are distinct and not too numerous to avoid clutter.
- Use
contrasting colors to differentiate between ribbons clearly.
- Make
use of data labels to provide additional context.
By following these steps, you can create an
insightful and visually appealing Ribbon Chart in Power BI. This type of chart
helps in understanding trends and changes in rankings over time, making it a
valuable tool for data analysis.
Conclusion
Creating a Ribbon Chart in Power BI is a
powerful way to visualize how categorical data changes over time, allowing you
to easily spot trends and shifts in rankings. This guide has walked you through
the steps to prepare your data, create and customize the Ribbon Chart, and add
interactivity for a more dynamic analysis experience.
For more detailed guidance and in-depth training, visit our training here.
Share:

