
Understanding Measures, Columns, and Tables in Power BI: A Comprehensive Guide
Jul 24, 2024
Understanding Measures,
Columns, and Tables in Power BI: A Comprehensive Guide
In today’s blog post, I’ll discuss how to effectively
create new columns, new tables, and new measures in Power BI using DAX,
empowering you to enhance your data models and reports with custom calculations
and aggregations.
Power BI offers powerful features for data modeling and
analysis. Among these, creating new measures, columns, and tables is
fundamental for customizing and enhancing your reports. This blog will guide
you through the process of adding new measures, columns, and tables in Power
BI, highlighting their uses and best practices.
1. Creating a New Measure
What is a Measure? A measure is a calculation used to aggregate
or summarize data. Measures are dynamic and respond to slicers and filters
applied in your reports.
Steps to Create a Measure:
- Open Power BI Desktop and
go to your report.
- Select the Table where
you want to add the measure from the Fields pane.Right-click on
the table and choose New Measure.
- Enter the Measure Formula using
DAX (Data Analysis Expressions). For example, to calculate the total
sales, you can use:
Total Sales = SUM(Sales[SalesAmount])
- Press Enter to
create the measure. It will now be available in your Fields pane.
Use Case Example: Creating a measure like Total Sales helps
you analyze the overall sales performance and visualize it using charts or
KPIs.
2. Creating a New Column
What is a Column? A column is used to store data in a table,
and it can be calculated based on other columns in the table. Unlike measures,
columns are static and do not change based on report interactions.
Steps to Create a New Column:
- Open Power BI Desktop and
navigate to your dataset.
- Select the Table where
you want to add the column.
- Right-click on the table and choose.
- Enter the Column Formula using
DAX. For example, to create a calculated column that determines if a sale
is high based on a threshold:
High Sale = IF(Sales[SalesAmount] > 1000,
"Yes", "No")
- Press Enter to
create the column. It will be added to your table and available for use in
your visuals.
Use Case Example: Adding a High Sale column allows you to
segment sales data and easily identify high-value transactions in your reports.
3. Creating a New Table
What is a Table? A table in Power BI is a collection of rows
and columns that can be used to store and manage data. New tables can be
created from existing data or by using DAX formulas.
Steps to Create a New Table:
- Open Power BI Desktop and
go to the Data view.
- Select the Modeling tab from
the ribbon.Click on New Table.
- Enter the Table Formula using
DAX. For example, to create a table that aggregates sales data by month:
MonthlySales = SUMMARIZE(Sales, Sales[Month],
"Total Sales", SUM(Sales[SalesAmount]))
- Press Enter to
create the table. It will appear in your Fields pane as a new table.
Use Case Example: Creating a MonthlySales table helps in
summarizing data by month, which can be useful for trend analysis and
reporting.
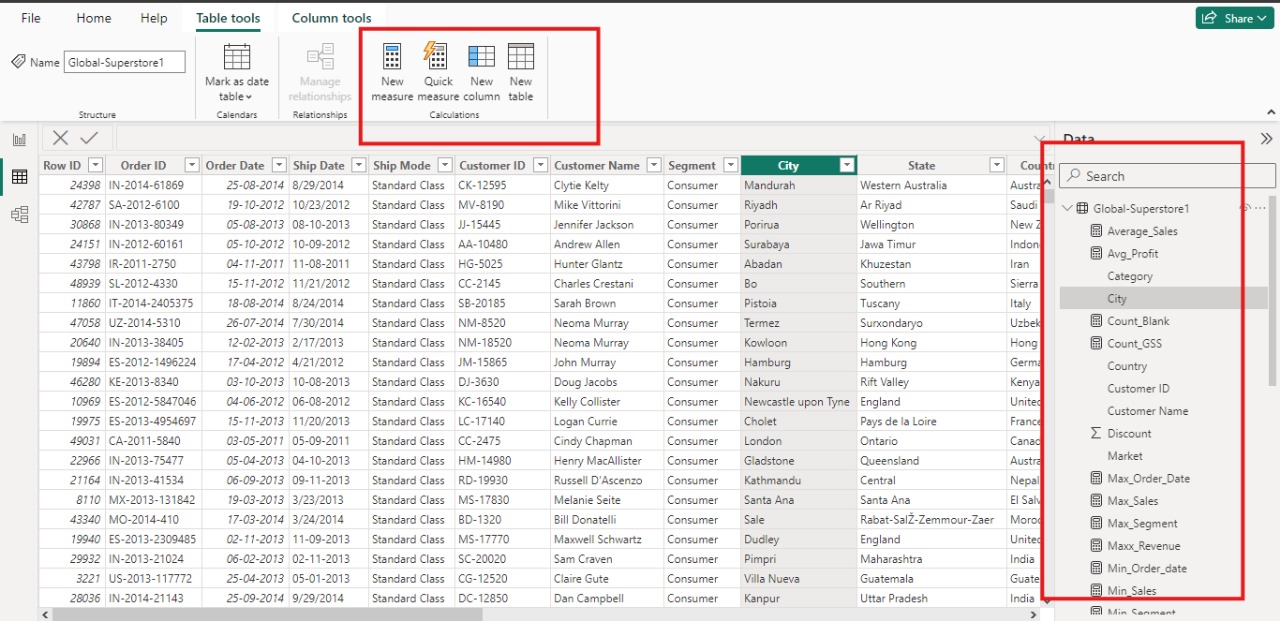
Example of Measures, New Table, New Column

Conclusion
In Power BI, mastering the creation and use of measures,
columns, and tables is crucial for building insightful and dynamic reports. Measures
allow for real-time data analysis, adapting to user interactions and filters,
while columns provide static calculations that enrich your data model. Creating
new tables helps you organize and aggregate data for deeper insights.
By leveraging these features effectively, you can tailor your reports to meet specific analytical needs, streamline data management, and enhance decision-making processes. Embracing these techniques will elevate your Power BI skills and lead to more powerful and insightful data visualizations.
For more detailed guidance and in-depth training, visit
our training here.
Share:

