
Precision in Averages: How to Use AVERAGE, AVERAGEX, and AVERAGEA in Power BI
Jul 25, 2024
Precision in Averages: How to
Use AVERAGE, AVERAGEX, and AVERAGEA in Power BI
In today’s blog post, I’ll discuss how to effectively
use the AVERAGE, AVERAGEX, and AVERAGEA functions in Power BI. These functions
will empower you to enhance your data models and reports by providing precise
and custom calculations of averages, allowing for more accurate data
analysis and insights.
In Power BI, calculating averages accurately is crucial
for data analysis and reporting. Power BI offers three primary functions for
this purpose: AVERAGE, AVERAGEX, and AVERAGEA. This blog will delve into the
details of these functions, their syntax, and their applications.
AVERAGE Function
The AVERAGE function is straightforward and commonly
used. It calculates the arithmetic mean of a column's values.
Syntax:
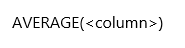
Example:
Suppose you have a table named Sales with a column Amount.
To calculate the average sales amount, you would use:
DAX
Average Sales = AVERAGE(Sales[Amount])
This function simply takes the Amount column and
computes the average of all its values. It's efficient and easy to use when you
need the average of a single column without any additional conditions.
AVERAGEX Function
The AVERAGEX function is more versatile. It evaluates an
expression for each row of a table and then returns the average of those
values. This function is particularly useful when you need to perform row-level
calculations before averaging.
Syntax:
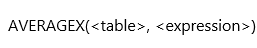
Example:
Consider a scenario where you need to calculate the
average sales per product category. If your Sales table has columns Category
and Amount, you can use:
DAX
Average Sales per Category = AVERAGEX(SUMMARIZE(Sales,
Sales[Category], "TotalSales", SUM(Sales[Amount])), [TotalSales])
In this example, SUMMARIZE creates a summary table with
total sales for each category, and AVERAGEX computes the average of these
totals. This demonstrates how AVERAGEX can handle more complex calculations
than AVERAGE.
AVERAGEA Function
The AVERAGEA function works similarly to AVERAGE but
includes a notable difference: it evaluates text and logical values as well.
Text values are treated as 0, and logical values are evaluated as 1 (TRUE) or 0
(FALSE).
Syntax:

Example:
If you have a table named Feedback with a column Ratings
that includes numbers, text, and logical values, you could use:
DAX
Average Feedback Rating = AVERAGEA(Feedback[Ratings])
This function will calculate the average of the Ratings
column, treating text values as 0 and logical values according to their binary
representation.
When to Use Each Function
Use AVERAGE: When you need a quick and straightforward
average of a single column's numeric values. It’s best for simple scenarios
where no additional calculations are required.
Use AVERAGEX: When your calculations involve more
complexity, such as calculating averages based on specific conditions or when
you need to perform intermediate calculations at the row level before
averaging.
Use AVERAGEA: When your data includes non-numeric values
that you want to account for in the average calculation. This function is
useful when dealing with mixed data types.
Practical Considerations
Performance: AVERAGE is generally faster for simple
calculations because it directly computes the mean of a column. AVERAGEX,
however, can be slower due to its row-by-row evaluation but provides
flexibility for complex calculations. AVERAGEA may also impact performance
slightly due to its handling of non-numeric values.
Flexibility: AVERAGEX offers greater flexibility for
advanced analytics, such as weighted averages or conditional calculations,
which are not possible with the AVERAGE function alone. AVERAGEA allows for
inclusion of mixed data types in average calculations.
Readability: While AVERAGEX can handle more complex
scenarios, it can also make your DAX code more difficult to read and maintain.
Use AVERAGE for clarity and simplicity whenever possible. Use AVERAGEA when
your dataset includes non-numeric values and you need them considered in your
average.
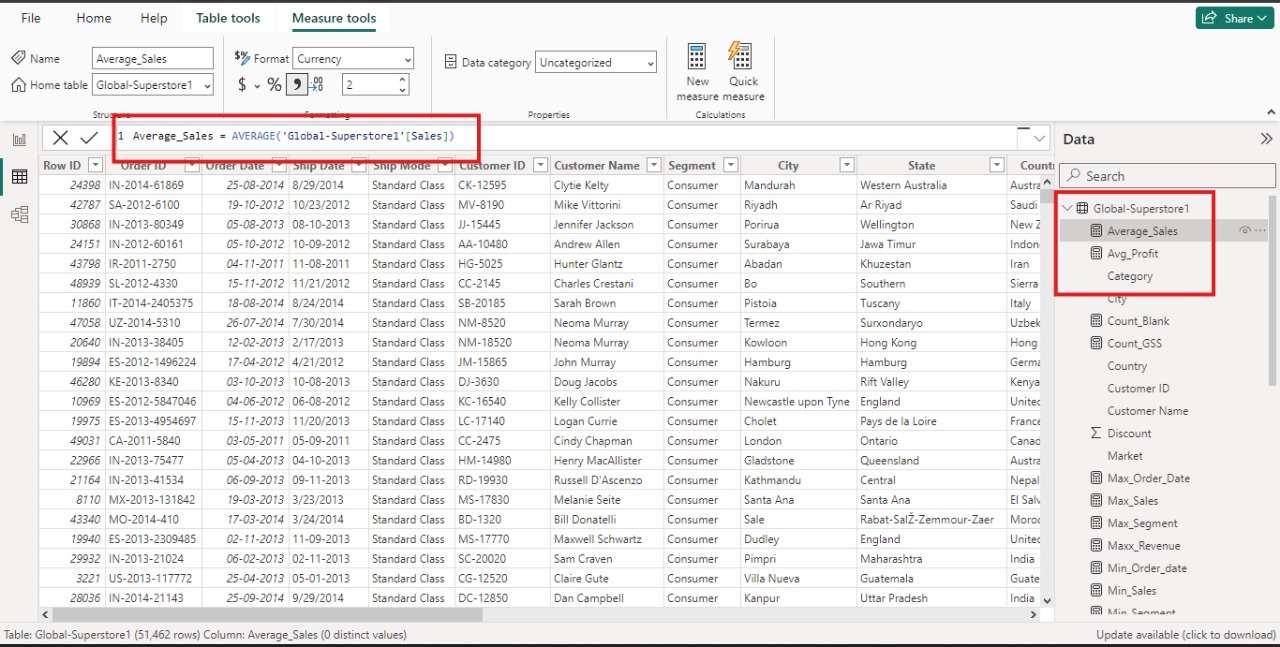
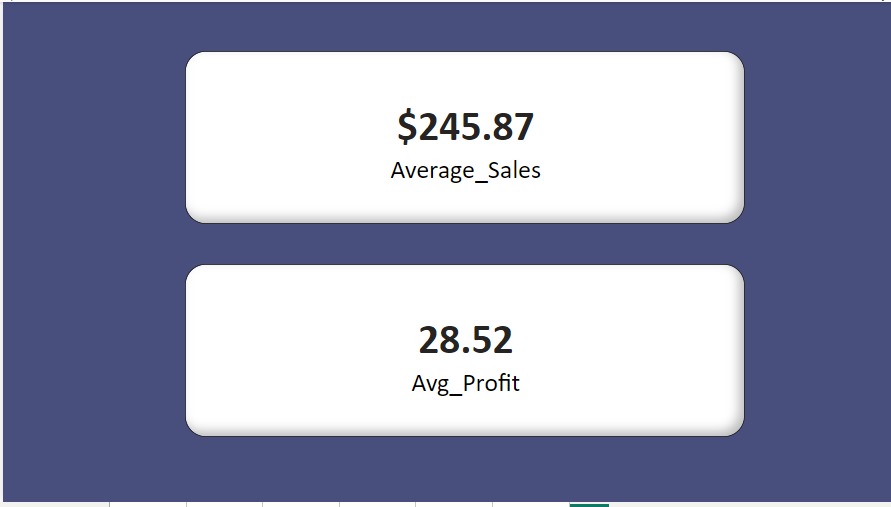
Illustrative Screenshots of AVERAGE, AVERAGEX, and AVERAGEA Functions in Power BI
Conclusion
Understanding when and how to use the AVERAGE, AVERAGEX,
and AVERAGEA functions in Power BI is crucial for effective data analysis. The AVERAGE
function is perfect for straightforward scenarios, while AVERAGEX shines in
complex calculations requiring row-by-row evaluation. AVERAGEA is ideal for
datasets with mixed data types. By choosing the right function for your needs,
you can enhance the accuracy and performance of your Power BI reports.
For more detailed guidance and in-depth training, visit our training here.
Share:

