
Harnessing the Power of Funnel Charts in Power BI.
Jul 18, 2024
Harnessing the Power of Funnel Charts in Power BI.
In today’s blog post, I'll guide you through
the steps to create a funnel chart in Power BI, along with tips and best
practices to ensure your data is displayed effectively.
Introduction
Funnel charts in Power BI are a great way to
visualize the progressive reduction of data as it passes through stages in a
process. They are often used to represent sales, marketing, and other business
processes.
Step
1: Prepare Your Data
Before creating a funnel chart, ensure your
data is structured appropriately. Funnel charts require data that can be
categorized into stages, with each stage showing a value representing the size
or count of items at that stage.
Here’s an example dataset for a sales
funnel:
|
Stage |
Count |
|
Prospects |
1000 |
|
Leads |
750 |
|
Opportunities |
500 |
|
Proposals |
300 |
|
Sales |
150 |
Step
2: Load Your Data into Power BI
- Open
Power BI Desktop.
- Click
on the Home tab and select Get Data.
- Choose
the appropriate data source (e.g., Excel, CSV, SQL Server).
- Load
your data into Power BI.
Step
3: Create the Funnel Chart
- Once
your data is loaded, go to the Visualizations pane on the right
side of the screen.
- Click
on the Funnel Chart icon. This will insert a blank funnel chart
into your report canvas.
- Drag
and drop the field representing the stages (e.g., Stage) to the Group
section in the Visualizations pane.
- Drag
and drop the field representing the values (e.g., Count) to the Values
section.
Your funnel chart should now display the
data in a funnel format, with the stages on the y-axis and the values on the
x-axis.
Step
4: Customize the Funnel Chart
To make your funnel chart more insightful
and visually appealing, customize it as follows:
Formatting
the Chart
- Click
on the funnel chart to select it.
- In
the Visualizations pane, click on the Format icon (paint roller).
Data
Colors
- Expand
the Data colors section.
- Choose
custom colors for each stage to make them easily distinguishable.
Data
Labels
- Expand
the Data labels section.
- Toggle
the switch to On to display the values on the chart.
- Adjust
the font size, color, and position as needed.
Title
and Background
- Expand
the Title section.
- Enter
a descriptive title for your chart.
- Adjust
the font, size, and color as needed.
- Expand
the Background section to add a background color if desired.
Step
5: Adding Tooltips
Tooltips can provide additional information
when hovering over each stage in the funnel chart.
- In
the Visualizations pane, drag any additional fields you want to display in
the tooltips to the Tooltips section.
- Customize
the tooltip display under the Format pane.
Best
Practices for Funnel Charts
- Order
Stages Correctly: Ensure that the
stages are logically ordered from start to finish to avoid confusion.
- Consistent
Metrics: Use consistent metrics across
stages to ensure accurate representation.
- Clear
Labels: Use clear and concise labels for
each stage.
- Highlight
Key Stages: Use color to highlight
significant stages or drop-offs in the funnel.
Example
of Funnel charts
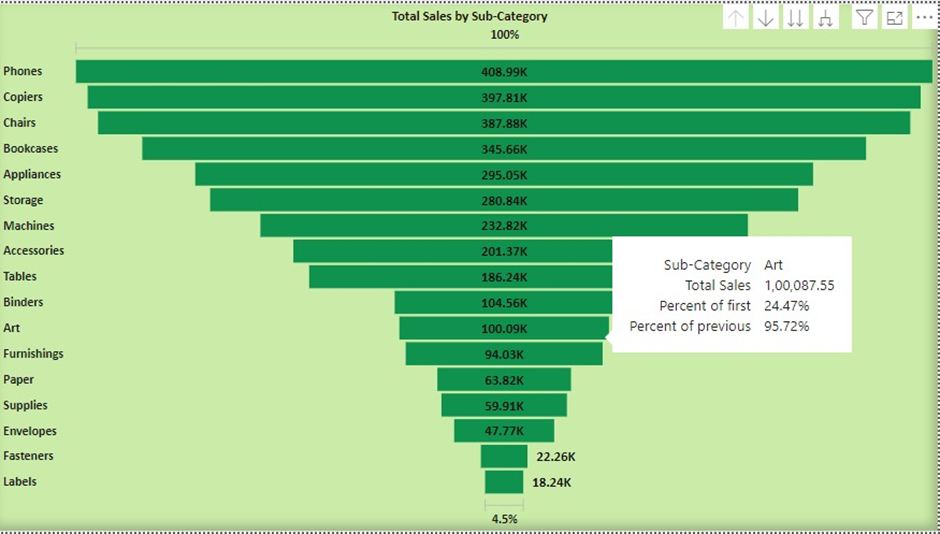
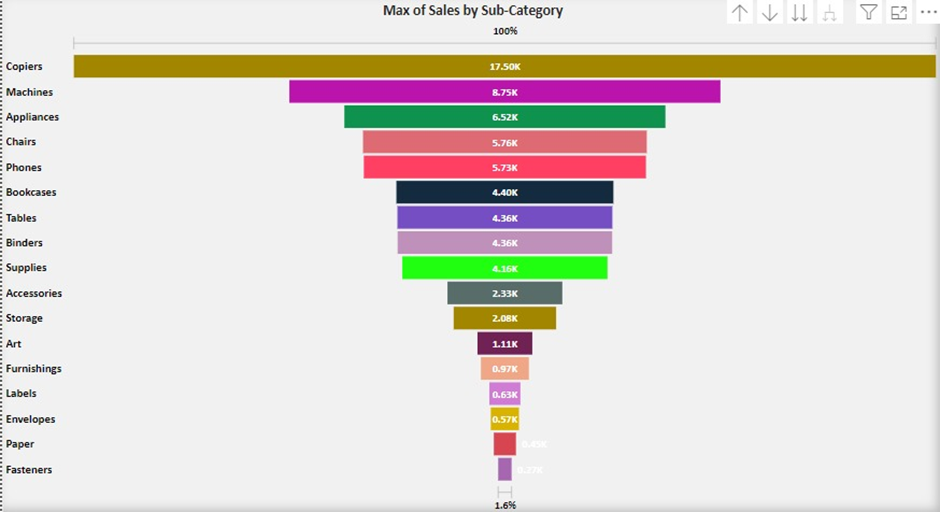
Conclusion
Funnel charts are a powerful tool in Power BI for visualizing processes that involve progressive data reduction. By following these steps, you can create a clear and effective funnel chart that provides valuable insights into your business processes.
For more detailed guidance and in-depth training, visit our training here.
Share:

