
From Days to Years: Understanding the DATEDIFF Function in Power BI
Aug 05, 2024
From Days to Years:
Understanding the DATEDIFF Function in Power BI
In today's post, I delve into the powerful capabilities
of the DATEDIFF function in Power BI, an essential tool for any data analyst
looking to perform precise date calculations. Whether you're calculating the
duration of projects, tracking shipping times, or analyzing employee tenure,
understanding how to effectively use the DATEDIFF function can significantly
enhance your time-based analyses. I will explore the syntax, provide practical
examples, and discuss various use cases to help you unlock valuable insights
from your data, making your reports and dashboards more informative and
actionable.
The DATEDIFF function in Power BI is used to calculate
the difference between two dates in terms of specified units such as days,
months, quarters, or years. This function is particularly useful for time-based
calculations in reports and dashboards.
Syntax

- StartDate: The
starting date for the calculation.
- EndDate: The
ending date for the calculation.
- Interval:
The unit in which the difference will be calculated. It can be one of the
following:
- SECOND
- MINUTE
- HOUR
- DAY
- WEEK
- MONTH
- QUARTER
- YEAR
Example
Let's assume you have a table named Sales with the
columns OrderDate and ShipDate. You want to calculate the number of days
between the order date and the ship date.
- Create a New Column:
DaysBetween = DATEDIFF(Sales[OrderDate],
Sales[ShipDate], DAY)
- Create a Measure:
DaysBetweenMeasure = DATEDIFF(MAX(Sales[OrderDate]),
MAX(Sales[ShipDate]), DAY)
Use Cases
- Calculating Tenure: Find
out how long employees have been with a company.
- Project Timelines: Determine
the duration of projects from start to finish.
- Age Calculation: Compute
the age of customers or products from their birthdate or launch date.
Practical Example
Imagine you are analyzing an e-commerce dataset and want
to see the average shipping time for orders.
- Import the Data: Load
your dataset, ensuring it includes order and ship dates.
- Add a Calculated Column:
Go
to the Modeling tab, click on New Column, and enter the following DAX
expression:
ShippingDuration = DATEDIFF(Sales[OrderDate],
Sales[ShipDate], DAY)
- Visualize the Data: Use a table or chart
to visualize the shipping duration. For example, create a bar chart that
shows the average shipping duration per month:
- Add
OrderDate (by month) to the X-axis.
- Add
ShippingDuration (average) to the Y-axis.
Key Points
- The
DATEDIFF function is straightforward but powerful for date-related
calculations.
- It
helps in various scenarios like calculating the time difference in
different units.
- Be
mindful of the date formats and ensure that your date columns are in the
correct format.
By using the DATEDIFF function, you can gain insights
into time-based metrics, enhancing your analysis and reporting capabilities in
Power BI.
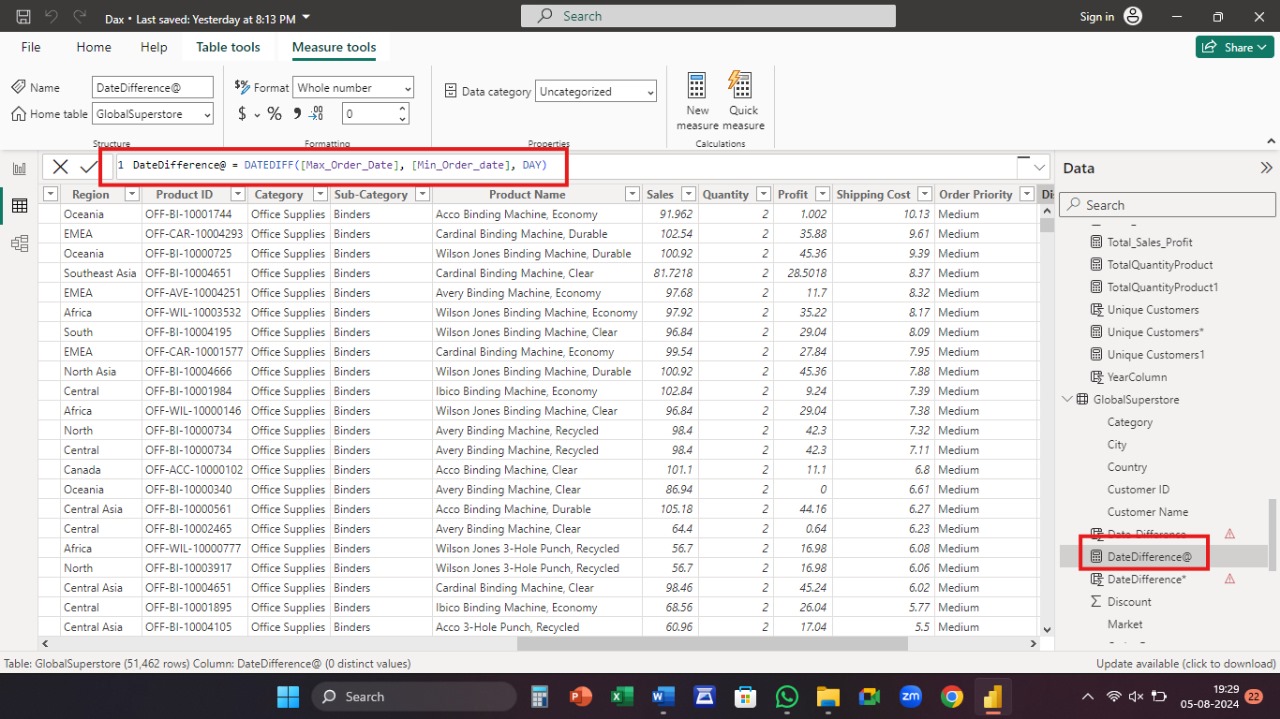
Illustrative
Example of DATEDIFF Function

Conclusion
In conclusion, the DATEDIFF function in Power BI is an
essential tool for performing date difference calculations. It enables users to
compute the time interval between two dates in various units, such as days,
months, or years, providing flexibility and precision in time-based analyses.
By leveraging this function, you can enhance your reports and dashboards with
insights into project durations, shipping times, employee tenure, and more.
Understanding and applying the DATEDIFF function effectively will undoubtedly
enrich your data analysis and help make informed decisions based on accurate
time-related metrics in Power BI.
For more detailed guidance and in-depth training, visit our training here.
Share:

