
Essential Techniques for Counting Rows in Power BI
Jul 26, 2024
Essential Techniques for
Counting Rows in Power BI
In today’s blog post, I’ll explore the techniques for
counting rows in Power BI. You’ll learn how to leverage DAX functions to
accurately determine the number of records in your datasets, enabling you to
summarize data effectively and gain valuable insights through precise data
analysis.
Counting rows is a fundamental operation in data
analysis and reporting. In Power BI, this task is efficiently handled using DAX
(Data Analysis Expressions) functions. Here’s a comprehensive guide to
understanding and implementing row counting in Power BI.
1. Introduction to Row
Counting
Row counting refers to determining the total number of
records or entries within a dataset. This operation is crucial for generating
insights, summarizing data, and making data-driven decisions.
2. Functions for Row Counting
In Power BI, the primary DAX functions for counting rows
are:
- COUNTROWS:
Counts the number of rows in a table or a table expression.
- COUNT:
Counts the number of non-blank values in a column.
- COUNTA: Counts
the number of non-blank values in a column, including text.
- COUNTAX:
Counts the number of non-blank values that result from an expression
evaluated over a table.
3. Using COUNTROWS
The COUNTROWS function is commonly used to count the
number of rows in a table. It provides a simple way to determine the size of a
dataset or a filtered subset of data.
- Syntax:
COUNTROWS(TableName)
4. Creating Measures for Row
Counting
To utilize row counting in Power BI:
- Define a New Measure: Create
a measure using the DAX COUNTROWS function to count rows dynamically based
on your data context.
- Incorporate Filters: Use
COUNTROWS in combination with other DAX functions like FILTER to count
rows under specific conditions.
5. Applications in Reporting
Row counting is used in various scenarios:
- Summary Reports: To
display the total number of records.
- Dashboards:
To provide quick insights into dataset size and changes over time.
- Comparative Analysis: To
compare the number of records across different segments or periods.
6. Best Practices
Accuracy: Ensure that your data model is correctly
set up to reflect accurate row counts.
Performance: Be mindful of performance when using row
counting in large datasets or complex filters.
Visualization: Use visual elements like cards or tables to
present row counts effectively.
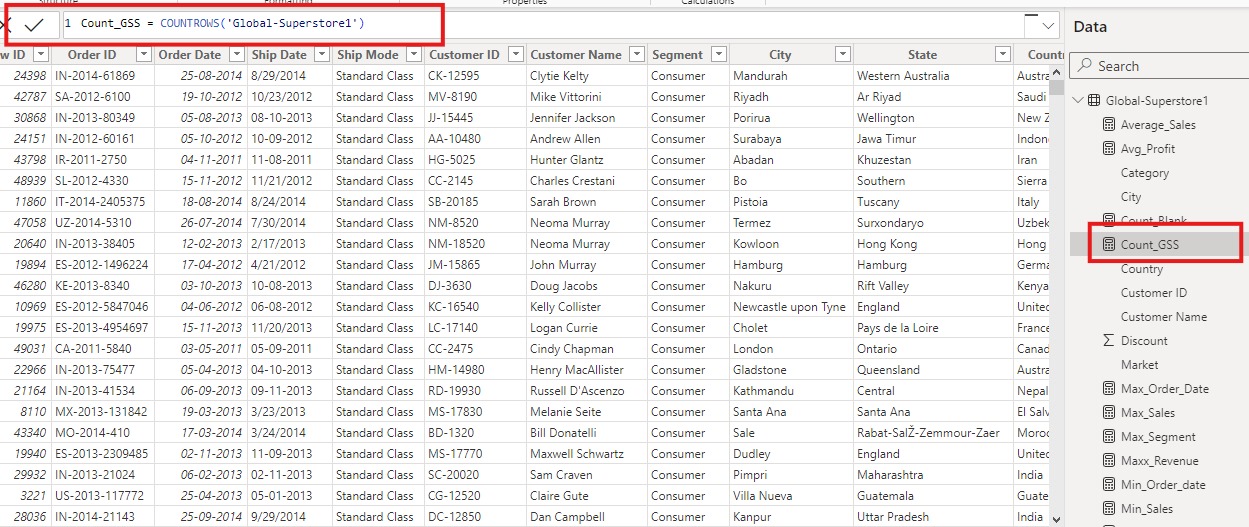
Example of Counting Rows function:

7. Conclusion
Understanding and implementing row counting in Power BI is essential for effective data analysis and reporting. By utilizing functions like COUNTROWS, you can gain valuable insights into your datasets and enhance your reports.
For more detailed guidance and in-depth training, visit our training here.
Share:

