
Effortless Yearly Data Analysis with the YEAR Function in Power BI
Jul 28, 2024
Effortless Yearly Data
Analysis with the YEAR Function in Power BI
In today’s blog post, I’ll discuss how to effectively
use the YEAR function in Power BI. This function will empower you to enhance
your data models and reports by providing precise and custom calculations of
yearly data, allowing for more accurate data analysis and insights.
In Power BI, the YEAR function is a powerful tool that
allows users to extract the year from a given date. This function can be
particularly useful for data analysis and reporting, enabling users to group
and analyze data by year. In this blog, we will explore the YEAR function in
Power BI, its syntax, and various use cases to help you leverage this function
effectively in your reports and dashboards.
Understanding the YEAR
Function
The YEAR function in Power BI is used to return the year
from a date value. The syntax for the YEAR function is straightforward:
date: This
is the date from which you want to extract the year. The date argument
must be a date data type or an expression that returns a date.
Example Usage
Let's look at a simple example to understand how the
YEAR function works.
Suppose you have a column in your dataset called
OrderDate, and you want to create a new column that contains only the year from
the OrderDate. You can achieve this using the YEAR function:
- Open
your Power BI Desktop and load your data.
- Go
to the Data view and select the table containing the OrderDate column.
- Click
on New Column in the Modeling tab.
- Enter
the following DAX formula:
OrderYear = YEAR('Table'[OrderDate])
This will create a new column called OrderYear that
contains the year extracted from the OrderDate column.
Practical Use Cases
The YEAR function can be used in various scenarios to
enhance your data analysis. Here are a few practical use cases:
1. Yearly Sales Analysis
By extracting the year from your sales data, you can
analyze sales trends on an annual basis. For example, you can create a bar
chart that shows total sales for each year:
- Create
a new column for the year using the YEAR function.
- Use
this column in a bar chart to display total sales per year.
2. Year-over-Year Growth
To calculate the year-over-year growth, you can use the
YEAR function to compare sales figures from different years. For instance:
- Create
a measure for total sales.
- Create
a measure for the previous year's sales.
- Calculate
the year-over-year growth as a percentage.
YoY Growth =
VAR CurrentYear = YEAR(TODAY())
VAR PreviousYear = CurrentYear - 1
VAR CurrentYearSales =
CALCULATE(SUM('Sales'[SalesAmount]), YEAR('Sales'[OrderDate]) = CurrentYear)
VAR PreviousYearSales =
CALCULATE(SUM('Sales'[SalesAmount]), YEAR('Sales'[OrderDate]) = PreviousYear)
RETURN
DIVIDE(CurrentYearSales - PreviousYearSales,
PreviousYearSales, 0)
3. Filtering Data by Year
You can use the YEAR function to filter your data by
specific years in your reports. For example, you can create a slicer to allow
users to filter data by year:
- Add
a new column for the year using the YEAR function.
- Use
this column in a slicer visual to enable year-based filtering.
Advanced Scenarios
In more advanced scenarios, you can combine the YEAR
function with other DAX functions to perform complex calculations. For example,
you can use the YEAR function with the CALCULATE function to create time
intelligence calculations, such as moving averages or cumulative totals.
Example: Cumulative Sales by
Year
To calculate cumulative sales by year, you can use the
following DAX formula:
Cumulative Sales =
CALCULATE(
SUM('Sales'[SalesAmount]),
FILTER(
ALL('Sales'),
'Sales'[OrderDate] <= MAX('Sales'[OrderDate]) &&
YEAR('Sales'[OrderDate]) = YEAR(MAX('Sales'[OrderDate]))
)
)
Example of YEAR FUNCTION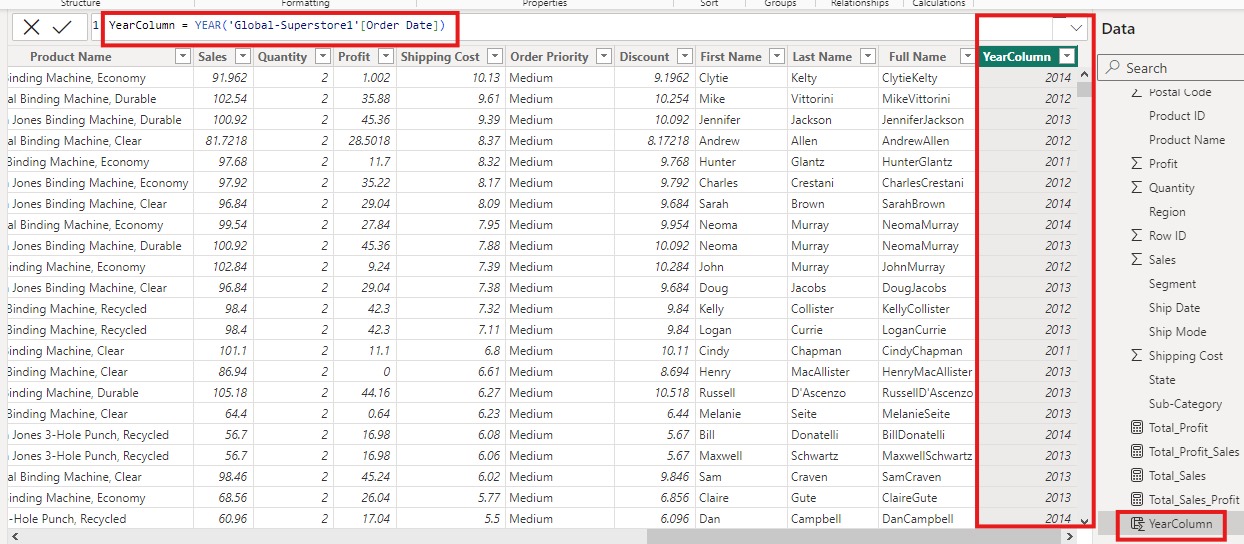 Conclusion
The YEAR function in Power BI is a versatile tool that can help you extract and analyze year-based data efficiently. By understanding its syntax and practical applications, you can enhance your data analysis and create more insightful reports and dashboards. Whether you're analyzing sales trends, calculating year-over-year growth, or filtering data by year, the YEAR function is an essential addition to your Power BI toolkit.
For more detailed guidance and in-depth training,
visit our training here.
Share:

