
Deep Dive into SUM and SUMX Functions in Power BI
Jul 25, 2024
A Deep Dive into SUM and SUMX Functions in Power BI
In today’s blog post, I’ll discuss the SUM and SUMX functions in Power BI. These functions are crucial for aggregating data and performing row-by-row calculations, allowing you to derive accurate totals and insights from your datasets. Understanding how to effectively use SUM and SUMX will enable you to enhance your data models and reports by providing precise and customizable aggregation solutions.
Power BI offers a range of powerful DAX (Data Analysis
Expressions) functions for data manipulation and analysis. Among these, SUM and
SUMX are essential for aggregating data. While they may seem similar, their use
cases differ significantly. This blog will delve into the differences, use
cases, and practical applications of these functions.
SUM Function
The SUM function is straightforward and used to add up
all the values in a single column.
Syntax:
Example:
Suppose you have a sales table with a column named
SalesAmount. To calculate the total sales, you would use:
DAX
Total Sales = SUM(Sales[SalesAmount])
SUMX Function
The SUMX function is more flexible and allows for
row-by-row calculations. It evaluates an expression for each row in a table and
then sums the results.
Syntax:

Example:
Imagine you have a sales table with Quantity and
UnitPrice columns. To calculate the total revenue, you can use:
DAX
Total Revenue = SUMX(Sales, Sales[Quantity] *
Sales[UnitPrice])
Key Differences Between SUM
and SUMX
Scope of Operation:
SUM operates on a single column and adds up its values
directly.
SUMX operates on an entire table, performing row-by-row
calculations based on an expression.
Use Case Complexity:
Use SUM for straightforward aggregations when you need
to sum up a single column.
Use SUMX for more complex scenarios where calculations
are required on a row-by-row basis.
Practical Examples
Let's explore some practical examples to highlight when
to use each function.
Example 1: Simple Aggregation
with SUM
You have a table named Orders with a TotalAmount column.
To get the total amount of all orders, you use:
DAX
Total Orders Amount = SUM(Orders[TotalAmount])
Example 2: Row-by-Row
Calculation with SUMX
You have a table named Orders with Quantity, UnitPrice,
and Discount columns. To calculate the total revenue considering discounts, you
can use:
DAX
Total Discounted Revenue = SUMX(Orders, Orders[Quantity]
* Orders[UnitPrice] * (1 - Orders[Discount]))
Performance Considerations
SUM:
Generally faster and more efficient because it performs a simple column
aggregation.
SUMX: Can be slower as it processes each row
individually. Ensure the table size and the complexity of the expression are
manageable to avoid performance issues.
Best Practices
Choose the Right Function: Use SUM for simple column summations and
SUMX for more complex, row-based calculations.
Optimize Expressions:
Keep expressions in SUMX as simple and efficient as possible to enhance
performance.
Test and Validate:
Always test your DAX formulas to ensure they return the expected results,
especially when using complex expressions with SUMX.
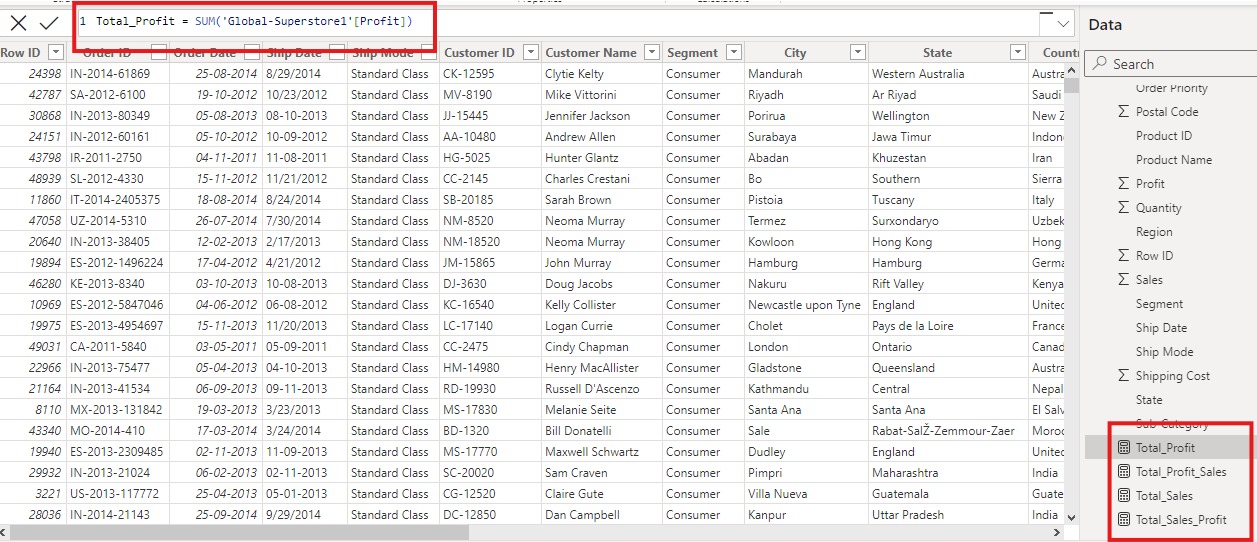
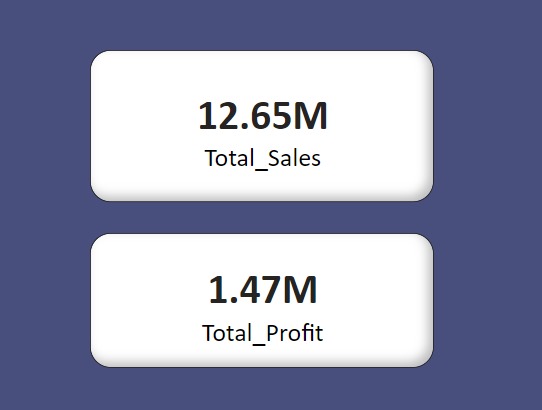
Illustrative Screenshots of SUM and SUMX Functions in Power BI
Conclusion
Understanding the differences between SUM and SUMX functions in Power BI is crucial for effective data analysis and reporting. By using the right function for the right scenario, you can ensure accurate and efficient calculations in your Power BI reports and dashboards. Experiment with these functions in your data models to master their applications and unlock the full potential of Power BI.
For more detailed guidance and in-depth training, visit our training here.
Share:

