
Creating End of Month Calculations in Power BI: A Comprehensive Guide
Jul 29, 2024
Creating End of Month
Calculations in Power BI: A Comprehensive Guide
In today’s blog post, I’ll dive into "Creating End
of Month Calculations in Power BI: A Comprehensive Guide" to help you
manage and analyze data more effectively, enhancing your reporting and
decision-making processes.
Creating an "End of Month" (EOM) calculation
in Power BI involves using DAX (Data Analysis Expressions) to determine the
last day of each month for a given date column. Here’s a detailed guide on how
to create an EOM calculation in Power BI:
1. Open Power BI Desktop and
Load Data:
Launch Power BI Desktop.
Load your data by selecting "Get
Data" and choosing your data source.
Import the data into Power BI.
2. Open the Data View:
Click on the "Data" view on the left-hand
side.
3. Create a New Column for
EOM:
In the "Modeling" tab, click on
"New Column."
Enter the following DAX formula to create
the EOM column:
EndOfMonth = EOMONTH('Table'[DateColumn], 0)
Here, 'Table' is the name of your table, and [DateColumn]
is the name of your date column. The EOMONTH function returns the last date of
the month that is the indicated number of months before or after the start
date. The 0 in the function indicates the current month.
4. Verify the EOM Column:
Ensure the new column EndOfMonth displays
the last day of each month for the corresponding date in your [DateColumn].
5. Create a Visualization
Using the EOM Column:
Switch to the "Report" view.
Create a new visualization, such as a table
or chart, and drag the EndOfMonth column to the visualization.
Example Visualization
To visualize sales data by the end of the month, you
can:
- Create
a new bar chart.
- Drag
the EndOfMonth column to the axis.
- Drag
the Sales column (or any other metric you are interested in) to the
values.
Advanced Usage: Creating an
EOM Measure
If you prefer to create an EOM measure instead of a
column:
- Go
to the "Modeling" tab and click on "New Measure."
- Enter
the following DAX formula:
EOMMeasure = EOMONTH(MAX('Table'[DateColumn]),
0)
- Use
this measure in your visualizations by adding it to the values or tooltips.
Example of EOM Function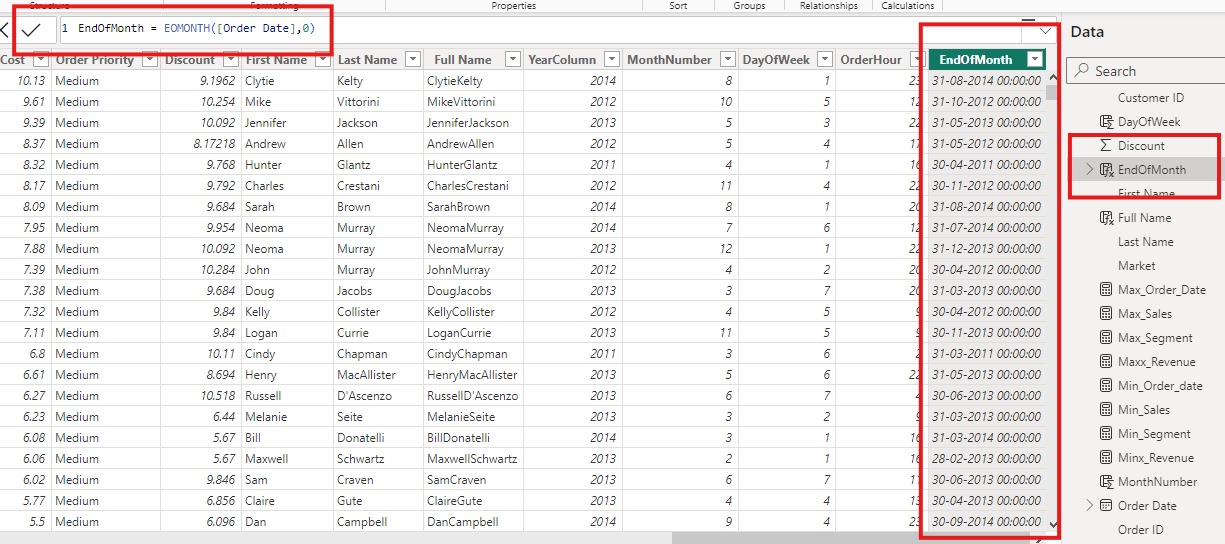
By following these steps, you can effectively create an End of Month calculation in Power BI using DAX. This allows you to analyze and visualize data based on the last day of each month, providing valuable insights for monthly reporting and trend analysis.
For more detailed guidance and in-depth training, visit our training here
Share:

