
Creating Comprehensive Date Tables with the CALENDAR Function in Power BI
Aug 05, 2024
Creating Comprehensive Date
Tables with the CALENDAR Function in Power BI
In today's blog post, I will delve into the CALENDAR Function in Power BI, a crucial tool
for anyone looking to perform time-based analysis and create comprehensive date
tables. The CALENDAR function allows you to generate a continuous range of
dates, which forms the backbone of time intelligence in Power BI. By
understanding and utilizing this function, you can enhance your reports and
dashboards, making them more dynamic and insightful. Whether you're tracking
sales trends over months or analyzing yearly performance, mastering the
CALENDAR function will empower you to unlock deeper insights from your data.
Join me as I explore the syntax, implementation, and practical applications of
the CALENDAR function in Power BI.
The CALENDAR function in Power BI is a powerful DAX
function that helps create a date table. A date table is essential for
time-based analysis, allowing you to create robust time intelligence reports
and visualizations. In this blog, I will explain how to use the CALENDAR
function to create a date table and demonstrate its application with examples.
What is the CALENDAR Function?
The CALENDAR function returns a single-column table of
dates with a specified start and end date. It is useful for generating a
continuous range of dates that you can use for date-related calculations and
visualizations.
Syntax
- start_date: The
first date in the date range.
- end_date: The
last date in the date range.
Creating a Date Table
To create a date table using the CALENDAR function,
follow these steps:
- Open Power BI Desktop and
go to the Data view.
- Click
on the Modeling tab and select New
Table.
- Enter
the following DAX formula:
DateTable = CALENDAR(DATE(2023, 1, 1), DATE(2023, 12,
31))
This formula creates a date table with dates ranging
from January 1, 2023, to December 31, 2023.
Adding Additional Columns
A basic date table is useful, but adding more columns
can enhance your analysis. Common columns include year, month, quarter, day,
and day of the week. Here’s how you can add these columns:
DateTable =
ADDCOLUMNS(
CALENDAR(DATE(2023, 1, 1), DATE(2023, 12, 31)),
"Year", YEAR([Date]),
"Month
Number", MONTH([Date]),
"Month
Name", FORMAT([Date], "MMMM"),
"Quarter", QUARTER([Date]),
"Day", DAY([Date]),
"Day of
Week", FORMAT([Date], "dddd")
)
Example Use Case
Imagine you have sales data, and you want to analyze it
by month. By creating a date table and establishing a relationship between the
date table and your sales data, you can easily create time-based
visualizations.
- Create the Date Table using
the steps mentioned above.
- Establish Relationships:
Go
to the Model view, and create a
relationship between the date column in your sales data and the date
column in your date table.
- Create Visualizations:
Use
the date table fields (like Year, Month Name, etc.) in your visuals to
analyze trends over time.
Illustrative
Example of CALENDAR Function 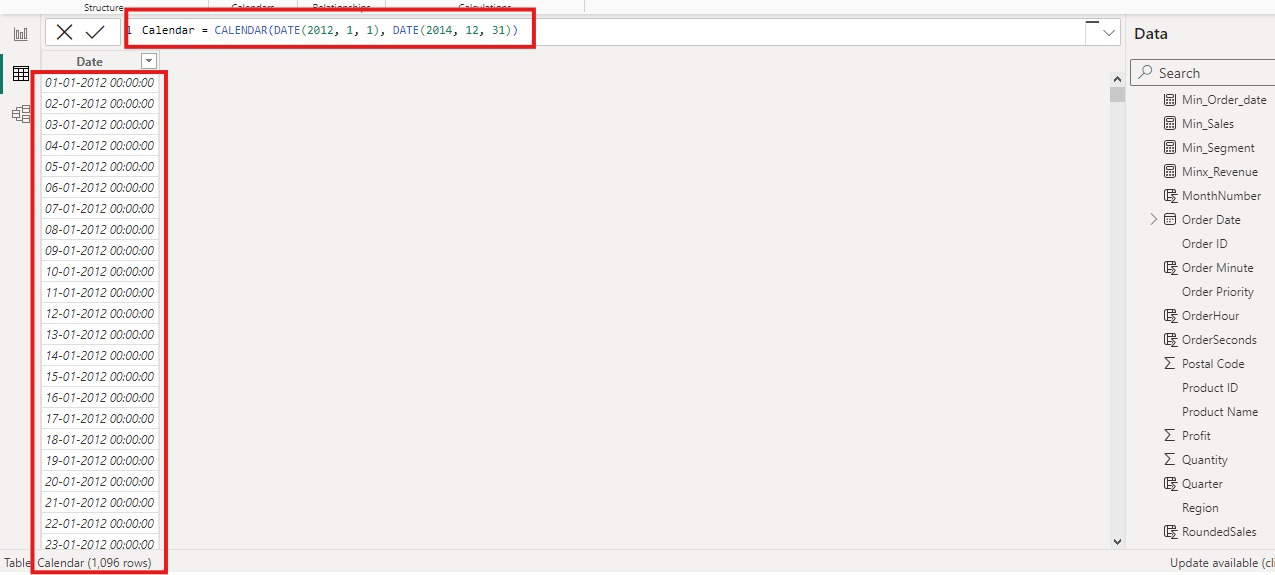
Conclusion
The CALENDAR function in Power BI is a foundational tool
for creating date tables, which are essential for performing time intelligence
calculations and generating insightful visualizations. By understanding how to
create and extend a date table, you can enhance your data models and unlock
powerful analysis capabilities.
For more detailed guidance and in-depth training, visit our training here.
Share:

