
Efficient Data Grouping in Power BI: A Beginner's Guide.
Jul 15, 2024
Efficient Data Grouping in Power BI: A Beginner's Guide.
In today’s blog post, I’ll walk you through the process of performing a
Group By operation in Power BI. Let’s dive in and explore how you can
efficiently aggregate and summarize your data to gain valuable insights.
Introduction
Grouping data is a crucial step in data analysis, allowing you to
condense large datasets into more manageable and insightful summaries. In Power
BI, the Group By feature enables you to aggregate data based on specific
columns, making it easier to uncover patterns, trends, and key metrics. Whether
you’re summarizing sales by region, calculating average scores, or counting
occurrences, Group By operations can significantly enhance your data
analysis capabilities.
Step-by-Step Guide
Step 1: Load Your Data
- Open
Power BI Desktop.
- Click
Get Data and load your data source.
Step 2: Open Power Query Editor
- Click
Transform Data to open Power Query Editor.
Step 3: Select the Table
- Choose
the table you want to group from the list on the left.
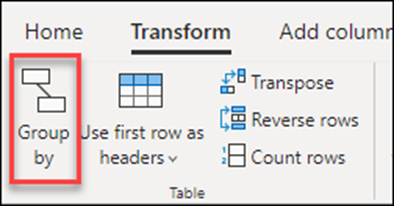
Step 4: Group By Operation
- Go
to the Home tab.
- Click
Group By in the Transform section.
Step 5: Configure the Group By
- Select
the column to group by.
- Add
aggregations (e.g., Sum, Average).
Example
sample table.

- On the Home tab,
in the Transform group.
- On
the Transform tab, in the Table group.
5.On the shortcut menu, when you
right-click to select columns.

Use an
aggregate function to group by one or more columns
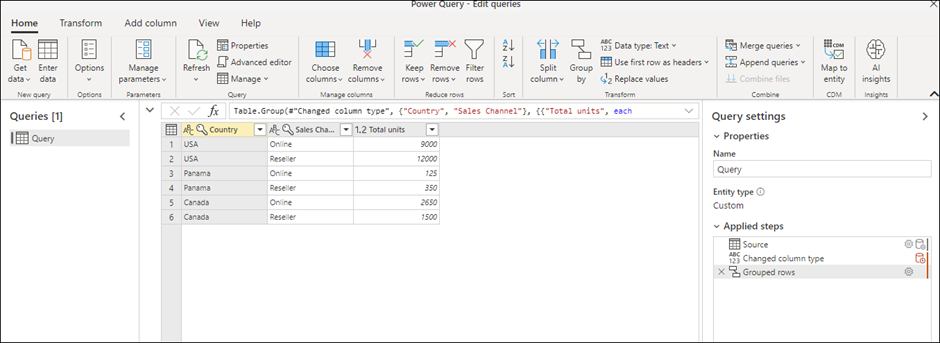
In this
example, your goal is to summarize the total units sold at the country and
sales channel level. You use the Country and Sales
Channel columns to perform the group by operation.
<!--[if !supportLists]-->1.
<!--[endif]-->Select Group by on
the Home tab.
<!--[if !supportLists]-->2.
<!--[endif]-->Select the Advanced option, so you can
select multiple columns to group by.
<!--[if !supportLists]-->3.
<!--[endif]-->Select the Country column.
<!--[if !supportLists]-->4.
<!--[endif]-->Select Add grouping.
<!--[if !supportLists]-->5.
<!--[endif]-->Select the Sales Channel column.
<!--[if !supportLists]-->6.
<!--[endif]-->In New column name, enter Total units,
in Operation, select Sum, and in Column, select Units.
<!--[if !supportLists]-->7. <!--[endif]-->Select OK

This operation gives you the following table.
Conclusion
Performing a Group By operation in Power BI is a powerful way to aggregate and summarize data, providing deeper insights and simplifying analysis. By following the steps outlined in this guide, you can effectively group your data to reveal patterns, trends, and key metrics. Mastering this feature will enhance your ability to create impactful reports and make data-driven decisions.
Share:

